Toronto Income Property Newsletter: August 2017

Toronto Income Property Market Analysis & Commentary – YTD 2017
When one determines the value of an income property based on its net income, we often use cap rates which are calculated by dividing the net income by the purchase price plus any improvements. This cap rate tells us the net return without factoring in any borrowing costs. Some investors look at the yearly return based on their invested capital, but this doesn’t really tell us the true profitability of the property or allow us to compare to other non-real estate investments.
When I started trading real estate, investors were looking for at least a five per cent cap rate and often were seeking returns in the sixes or sevens. Nowadays, a five cap is actually quite rare. Over the past year, many properties were priced such that they were only yielding a 4% cap rate. Or in some cases even less. In my opinion, if a property isn’t getting at least a 4% return, there are better places to put your money.
The MLS market numbers for June suggested that while the number of year-on-year trades declined, the average prices essentially stayed the same. It seems that until we have a precipitous decline in prices, the returns will continue to be in the high three to lower four per cent range. There are many of us who believe that this simply isn’t going to happen. This 4 cap phenomena has somewhat become the new normal for plexes in Toronto at least in the downtown core and I expect will continue to be the benchmark for the foreseeable future.
There isn’t any cap rate data available from MLS or other sources and many listed income properties do not even provide complete income and expenses. It is only when we forecast market rents and guesstimate monthly expenses that we can determine a true cap rate – so for this analysis we can only look at average sale prices to get a sense of what has been going on.
For the purposes of this analysis, I looked at all the YTD sales of income properties with 3 or more kitchens in four different Toronto areas. While 2 kitchen properties (duplexes and homes with basement apartments) also qualify as potential income properties, with three kitchens we can be assured that there is definitely a rental component.
Downtown Toronto: C01, C08
There were 39 sales and the average price was $1,676,354
The Days on Market (how long it took on average to sell) was 18 days.
Midtown Toronto: C03, C04
There were 17 sales and the average price was $1,957,039
The Days on Market was 22 days.
East Side: E01, E02, E03
There were 28 sales and the average price was $1,398,982
The Days on Market was 23 days.
West Side: W01, W02
There were 50 sales and the average price was $1.494,368
The Days on Market was 29.
Based on a 4 per cent cap rate if the average price in the GTA for a multiplex was around $1.6 million then we can assume the average net return is somewhere is the 64K range.
This is very interesting when you compare the income property stats to regular houses across the board. In Toronto, the average YTD price for a semi-detached house rose 4.3 per cent to $949,546 and for a detached house, 9.9 per cent to $1,416,908 for the first half of June compared with the same period last year. By contrast, the average price of a condo unit in the 416 soared 23.7 per cent to $558,691 over the same period.
Current Toronto MLS stats indicates average house prices have since dropped to $778,173 and 4,530 new listings in the last 28 days. As of today, Toronto housing data shows median days on market for a home is 20 days.
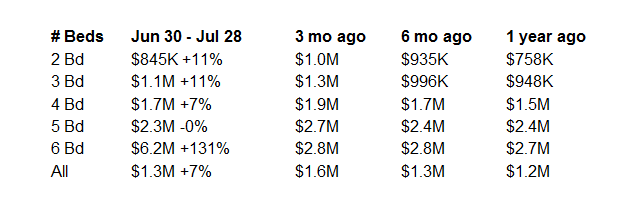
Here is a breakdown of average prices by number of bedrooms for a single-family property in Toronto.