2022 Toronto Income Property Market Wrap-up (Jan to Jun)
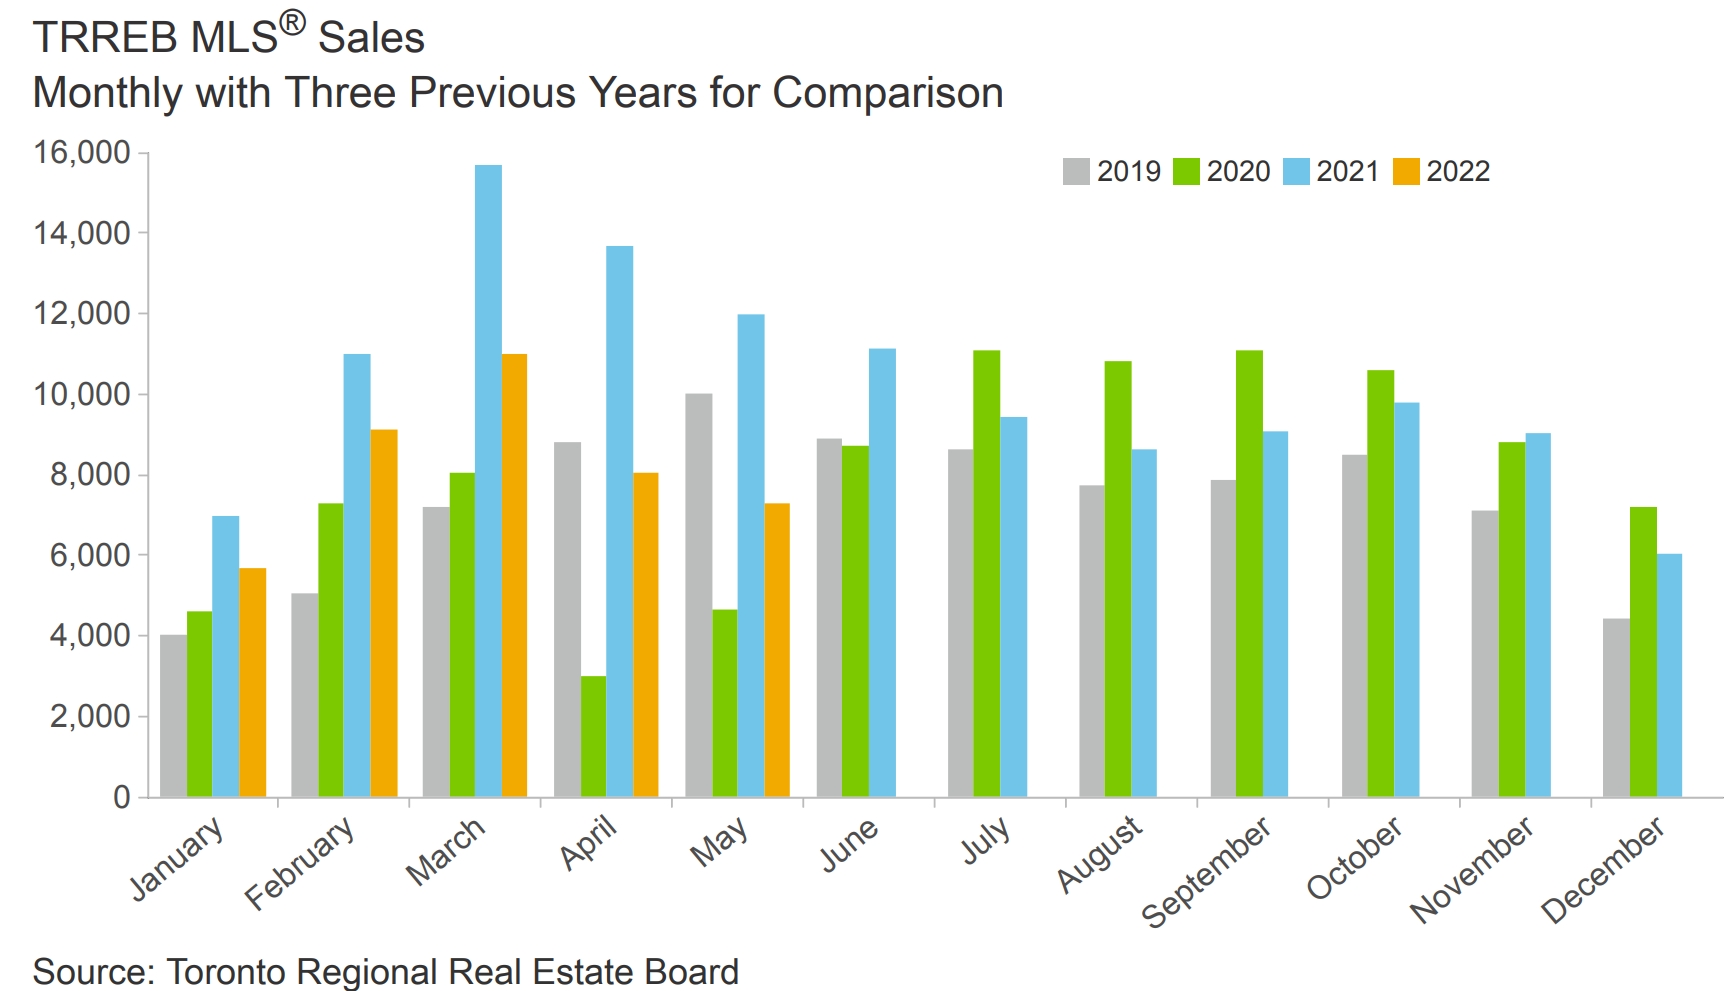
As we have just passed the midway point of the year, it is interesting to look at key areas of the city and see how the income property market has been performing so far this year. As the market turns away from favoring Sellers, we expect these numbers to decline in the second half of this year. Most real estate experts agree that a more balanced market is better overall for everyone and that is what we are headed towards.
Here are some sales stats from different neighbourhoods for Jan to July 2022. These represent all TRREB MLS w 3 or more kitchens (does not count duplexes or properties with basement apartments):
C01 – Downtown Toronto
17 Total Sales
Avg Price: 2,495,818 (108% of asking)
C02 – Annex
9 Total Sales
Avg Price: 2,644,533 (96% of asking)
E01 – Riverdale, Leslieville
7 Total Sales
Avg. Price: 1,762,114 (110% of asking)
E02 – Beaches
8 Total Sales
Avg Price: 2,271,875 (99% of asking)
W01 – High Park/Swansea
14 Total Sales
Avg Price: 2,431.787 (103% of asking)
W02 – Bloor West Village
22 Total Sales
Avg Price: 1,678,718 (104% of asking)
The one thing that is very noticeable is that in four of the six regions is income properties traded for over asking price, which is indicative of multiple offers. It is expected that this number will decrease going forward and most sales will land in between 95 to 99% of the asking price across the GTA.